Below is a chart that shows Utah Short Term Radon Test Results By County and ZIP Code as of June 2019.
I have not been able to find updated data, but this is useful info.
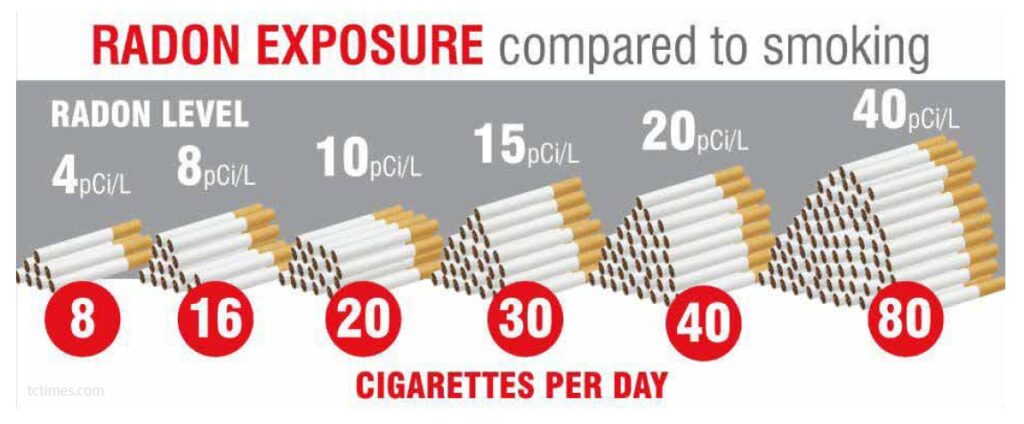
For more information on Radon, visit our Radon Testing Page
| 84501 | 68.2% | 31.8% | 280.0 | 5.2 | 151 |
| 84520 | 77.8% | 22.2% | 4.2 | 2.2 | 9 |
| 84526 | 88.0% | 12.0% | 4.9 | 2.0 | 25 |
| 84529 | 100.0% | 0.0% | 1.6 | 1.6 | 1 |
| 84542 | 39.1% | 60.9% | 16.5 | 7.9 | 23 |
| Carbon | 67.9% | 32.1% | 280.0 | 5.0 | 209 |
| DAGGETT | |||||
| ZIP CODE | <4 pCi/L | >=4 pCi/L | Maximum | Average | Total Tests |
| 84023 | 100.0% | 0.0% | 1.0 | 0.9 | 3 |
| 84046 | 100.0% | 0.0% | 3.3 | 1.0 | 19 |
| Daggett | 100.0% | 0.0% | 3.3 | 1.0 | 22 |
| DAVIS | |||||
| ZIP CODE | <4 pCi/L | >=4 pCi/L | Maximum | Average | Total Tests |
| 84010 | 57.0% | 43.0% | 215.0 | 5.7 | 1358 |
| 84011 | 73.9% | 26.1% | 12.8 | 3.5 | 23 |
| 84014 | 42.8% | 57.2% | 101.2 | 7.6 | 544 |
| 84015 | 90.2% | 9.8% | 49.8 | 2.2 | 562 |
| 84016 | 88.9% | 11.1% | 6.3 | 1.7 | 9 |
| 84025 | 54.5% | 45.5% | 63.7 | 5.1 | 508 |
| 84037 | 79.6% | 20.4% | 77.2 | 3.2 | 680 |
| 84040 | 80.5% | 19.5% | 208.3 | 3.4 | 478 |
| 84041 | 85.9% | 14.1% | 41.1 | 2.6 | 418 |
| 84054 | 78.7% | 21.3% | 64.0 | 3.4 | 314 |
| 84056 | 100.0% | 0.0% | 2.2 | 1.3 | 11 |
| 84075 | 85.3% | 14.7% | 9.6 | 2.4 | 265 |
| 84087 | 62.7% | 37.3% | 61.7 | 5.7 | 308 |
| 84089 | 50.0% | 50.0% | 7.7 | 3.7 | 4 |
| Davis | 69.2% | 31.0% | 215.0 | 4.4 | 5482 |
| DUCHESNE | |||||
| ZIP CODE | <4 pCi/L | >=4 pCi/L | Maximum | Average | Total Tests |
| 84001 | 100.0% | 0.0% | 3.2 | 1.5 | 3 |
| 84007 | 66.7% | 33.3% | 5.4 | 2.8 | 3 |
| 84021 | 77.8% | 22.2% | 67.7 | 6.8 | 27 |
| 84027 | 33.3% | 66.7% | 31.1 | 20.8 | 3 |
| 84031 | 0.0% | 100.0% | 45.1 | 28.7 | 3 |
| 84051 | 100.0% | 0.0% | 1.6 | 1.6 | 1 |
| 84052 | 80.0% | 20.0% | 39.5 | 5.9 | 15 |
| 84053 | 100.0% | 0.0% | 1.4 | 1.0 | 3 |
| 84066 | 73.5% | 26.5% | 67.9 | 5.0 | 83 |
| 84072 | 94.7% | 5.3% | 5.3 | 1.1 | 19 |
| 84073 | 100.0% | 0.0% | 2.0 | 0.8 | 8 |
| Duchesne | 77.4% | 22.6% | 67.9 | 5.3 | 168 |
| EMERY | |||||
| ZIP CODE | <4 pCi/L | >=4 pCi/L | Maximum | Average | Total Tests |
| 84513 | 40.0% | 60.0% | 5.8 | 4.8 | 5 |
| 84518 | 55.6% | 44.4% | 7.8 | 3.7 | 9 |
| 84522 | 100.0% | 0.0% | 3.7 | 2.8 | 2 |
| 84523 | 60.0% | 40.0% | 5.7 | 3.0 | 5 |
| 84525 | 100.0% | 0.0% | 3.2 | 1.5 | 5 |
| 84528 | 64.3% | 35.7% | 28.8 | 4.9 | 14 |
| 84537 | 100.0% | 0.0% | 1.2 | 1.2 | 1 |
| Emery | 65.9% | 34.1% | 28.8 | 3.8 | 41 |
| GARFIELD | |||||
| ZIP CODE | <4 pCi/L | >=4 pCi/L | Maximum | Average | Total Tests |
| 84712 | 0.0% | 100.0% | 7.8 | 7.8 | 1 |
| 84716 | 100.0% | 0.0% | 3.9 | 2.4 | 5 |
| 84718 | 100.0% | 0.0% | 0.8 | 0.8 | 1 |
| 84726 | 66.7% | 33.3% | 13.8 | 4.3 | 9 |
| 84735 | 50.0% | 50.0% | 20.5 | 7.7 | 4 |
| 84736 | 100.0% | 0.0% | 2.8 | 2.8 | 1 |
| 84759 | 48.1% | 51.9% | 32.1 | 7.2 | 27 |
| 84776 | 100.0% | 0.0% | 3.5 | 3.5 | 1 |
| Garfield | 59.2% | 40.8% | 32.1 | 6.0 | 49 |
| GRAND | |||||
| ZIP CODE | <4 pCi/L | >=4 pCi/L | Maximum | Average | Total Tests |
| 84532 | 88.0% | 12.0% | 44.5 | 2.6 | 133 |
| Grand | 88.0% | 12.0% | 44.5 | 2.6 | 133 |
| IRON | |||||
| ZIP CODE | <4 pCi/L | >=4 pCi/L | Maximum | Average | Total Tests |
| 84719 | 100.0% | 0.0% | 0.8 | 0.8 | 1 |
| 84720 | 88.2% | 11.8% | 19.6 | 2.2 | 347 |
| 84721 | 75.0% | 25.0% | 14.8 | 3.0 | 140 |
| 84742 | 100.0% | 0.0% | 2.1 | 1.6 | 8 |
| 84760 | 100.0% | 0.0% | 1.8 | 1.5 | 2 |
| 84761 | 72.2% | 27.8% | 28.3 | 3.9 | 18 |
| Iron | 84.3% | 15.7% | 28.3 | 2.4 | 516 |
| JUAB | |||||
| ZIP CODE | <4 pCi/L | >=4 pCi/L | Maximum | Average | Total Tests |
| 84628 | 71.4% | 28.6% | 6.8 | 3.5 | 7 |
| 84639 | 60.0% | 40.0% | 12.3 | 5.9 | 5 |
| 84645 | 37.9% | 62.1% | 61.0 | 6.9 | 58 |
| 84648 | 47.6% | 52.4% | 18.1 | 5.7 | 42 |
| Juab | 44.6% | 55.4% | 61.0 | 6.2 | 112 |
| KANE | |||||
| ZIP CODE | <4 pCi/L | >=4 pCi/L | Maximum | Average | Total Tests |
| 84710 | 100.0% | 0.0% | 1.0 | 1.0 | 1 |
| 84729 | 0.0% | 100.0% | 7.1 | 7.1 | 2 |
| 84741 | 72.4% | 27.6% | 30.8 | 3.9 | 87 |
| 84755 | 0.0% | 100.0% | 26.1 | 24.7 | 4 |
| 84758 | 100.0% | 0.0% | 3.7 | 3.7 | 1 |
| 84762 | 80.0% | 20.0% | 4.6 | 2.4 | 5 |
| Kane | 69.0% | 31.0% | 30.8 | 4.7 | 100 |
| MILLARD | |||||
| ZIP CODE | <4 pCi/L | >=4 pCi/L | Maximum | Average | Total Tests |
| 84624 | 93.9% | 6.1% | 8.0 | 2.4 | 33 |
| 84631 | 65.2% | 34.8% | 10.0 | 3.5 | 23 |
| 84635 | 100.0% | 0.0% | 2.2 | 2.0 | 2 |
| 84636 | 100.0% | 0.0% | 0.9 | 0.9 | 1 |
| 84637 | 71.4% | 28.6% | 6.0 | 3.1 | 7 |
| 84638 | 50.0% | 50.0% | 7.3 | 4.7 | 2 |
| 84640 | 100.0% | 0.0% | 1.4 | 1.4 | 1 |
| 84644 | 50.0% | 50.0% | 7.7 | 5.2 | 2 |
| 84649 | 85.7% | 14.3% | 6.2 | 2.4 | 7 |
| 84656 | 0.0% | 100.0% | 9.9 | 9.9 | 1 |
| Millard | 79.7% | 20.3% | 10.0 | 2.9 | 79 |
| MORGAN | |||||
| ZIP CODE | <4 pCi/L | >=4 pCi/L | Maximum | Average | Total Tests |
| 84018 | 33.3% | 66.7% | 200.0 | 39.8 | 6 |
| 84050 | 47.8% | 52.2% | 41.1 | 5.8 | 272 |
| Morgan | 47.5% | 52.5% | 200.0 | 6.6 | 278 |
| PIUTE | |||||
| ZIP CODE | <4 pCi/L | >=4 pCi/L | Maximum | Average | Total Tests |
| 84723 | 100.0% | 0.0% | 3.1 | 1.8 | 4 |
| 84740 | 100.0% | 0.0% | 1.8 | 1.8 | 1 |
| 84750 | 50.0% | 50.0% | 23.5 | 6.3 | 6 |
| Piute | 72.7% | 27.3% | 23.5 | 4.2 | 11 |
| RICH | |||||
| ZIP CODE | <4 pCi/L | >=4 pCi/L | Maximum | Average | Total Tests |
| 84028 | 85.7% | 14.3% | 14.8 | 2.9 | 14 |
| 84038 | 0.0% | 100.0% | 30.8 | 11.3 | 12 |
| 84064 | 66.7% | 33.3% | 21.2 | 4.5 | 12 |
| 84086 | 100.0% | 0.0% | 2.2 | 2.2 | 1 |
| Rich | 53.8% | 46.2% | 30.8 | 6.0 | 39 |
| SALT LAKE | |||||
| ZIP CODE | <4 pCi/L | >=4 pCi/L | Maximum | Average | Total Tests |
| 84006 | 34.4% | 65.6% | 81.0 | 12.9 | 61 |
| 84009 | 64.6% | 35.4% | 24.8 | 4.1 | 370 |
| 84020 | 65.0% | 35.0% | 86.0 | 4.5 | 1515 |
| 84044 | 58.2% | 41.8% | 20.7 | 4.3 | 225 |
| 84047 | 69.0% | 31.0% | 35.0 | 3.6 | 520 |
| 84065 | 47.2% | 52.8% | 130.3 | 6.1 | 1308 |
| 84070 | 87.4% | 12.6% | 152.6 | 2.3 | 3244 |
| 84081 | 68.7% | 31.3% | 54.2 | 4.2 | 556 |
| 84084 | 59.7% | 40.3% | 40.0 | 4.4 | 568 |
| 84088 | 53.3% | 46.7% | 30.7 | 4.9 | 585 |
| 84090 | 53.1% | 46.9% | 280.0 | 16.9 | 32 |
| 84091 | 71.4% | 28.6% | 7.9 | 2.8 | 14 |
| 84092 | 57.6% | 42.4% | 152.0 | 5.3 | 1944 |
| 84093 | 44.5% | 55.5% | 90.8 | 7.2 | 1816 |
| 84094 | 73.8% | 26.2% | 40.7 | 3.3 | 823 |
| 84095 | 55.5% | 44.5% | 99.8 | 5.0 | 1817 |
| 84096 | 57.6% | 42.4% | 250.0 | 5.5 | 1131 |
| 84101 | 80.6% | 19.4% | 7.7 | 2.1 | 31 |
| 84102 | 69.9% | 30.1% | 56.9 | 4.2 | 332 |
| 84103 | 77.4% | 22.6% | 70.2 | 3.4 | 678 |
| 84104 | 70.9% | 29.1% | 31.8 | 3.6 | 158 |
| 84105 | 62.5% | 37.5% | 27.4 | 3.9 | 1142 |
| 84106 | 77.3% | 22.7% | 42.7 | 3.1 | 2474 |
| 84107 | 74.4% | 25.6% | 31.1 | 3.3 | 558 |
| 84108 | 81.4% | 18.6% | 27.3 | 2.7 | 898 |
| 84109 | 65.1% | 34.9% | 50.1 | 4.0 | 1088 |
| 84110 | 73.3% | 26.7% | 22.6 | 4.0 | 30 |
| 84111 | 60.5% | 39.5% | 40.6 | 4.3 | 162 |
| 84112 | 90.9% | 9.1% | 6.0 | 1.5 | 11 |
| 84113 | 100.0% | 0.0% | 3.9 | 1.8 | 4 |
| 84114 | 59.5% | 40.5% | 54.4 | 7.3 | 121 |
| 84115 | 65.8% | 34.2% | 47.7 | 3.7 | 319 |
| 84116 | 76.4% | 23.6% | 36.4 | 3.2 | 259 |
| 84117 | 65.2% | 34.8% | 86.1 | 4.3 | 715 |
| 84118 | 74.6% | 25.4% | 85.4 | 3.5 | 472 |
| 84119 | 73.8% | 26.2% | 21.4 | 2.9 | 317 |
| 84120 | 63.9% | 36.1% | 140.5 | 4.1 | 360 |
| 84121 | 71.5% | 28.5% | 50.0 | 3.7 | 1881 |
| 84122 | 100.0% | 0.0% | 3.0 | 2.6 | 2 |
| 84123 | 71.5% | 28.5% | 33.5 | 3.4 | 613 |
| 84124 | 63.1% | 36.9% | 43.1 | 4.3 | 975 |
| 84125 | 100.0% | 0.0% | 2.8 | 2.3 | 2 |
| 84126 | 0.0% | 100.0% | 4.3 | 4.3 | 1 |
| 84127 | 66.7% | 33.3% | 6.9 | 4.1 | 3 |
| 84128 | 67.7% | 32.3% | 36.5 | 3.8 | 220 |
| 84129 | 67.6% | 32.4% | 22.0 | 3.8 | 210 |
| 84130 | 100.0% | 0.0% | 1.9 | 1.1 | 3 |
| 84138 | 100.0% | 0.0% | 1.4 | 1.4 | 1 |
| 84145 | 0.0% | 100.0% | 7.4 | 7.2 | 2 |
| 84147 | 75.0% | 25.0% | 7.8 | 3.1 | 4 |
| 84151 | 0.0% | 100.0% | 4.1 | 4.1 | 1 |
| 84152 | 75.0% | 25.0% | 18.4 | 3.7 | 24 |
| 84157 | 71.4% | 28.6% | 7.0 | 3.1 | 7 |
| 84158 | 82.4% | 17.6% | 8.8 | 2.3 | 17 |
| 84165 | 50.0% | 50.0% | 5.2 | 4.5 | 2 |
| 84170 | 80.0% | 20.0% | 10.3 | 3.1 | 5 |
| 84171 | 63.3% | 36.7% | 27.8 | 5.2 | 60 |
| 84184 | 0.0% | 100.0% | 11.6 | 11.6 | 1 |
| Salt Lake | 66.8% | 33.2% | 280.0 | 4.2 | 30692 |
| SAN JUAN | |||||
| ZIP CODE | <4 pCi/L | >=4 pCi/L | Maximum | Average | Total Tests |
| 84511 | 89.0% | 11.0% | 13.5 | 1.8 | 155 |
| 84512 | 100.0% | 0.0% | 0.8 | 0.8 | 1 |
| 84530 | 71.4% | 28.6% | 12.7 | 4.4 | 7 |
| 84531 | 100.0% | 0.0% | 1.3 | 1.3 | 1 |
| 84533 | 100.0% | 0.0% | 0.1 | 0.1 | 2 |
| 84535 | 56.0% | 44.0% | 21.0 | 4.5 | 207 |
| San Juan | 70.5% | 29.5% | 21.0 | 3.4 | 373 |
| SANPETE | |||||
| ZIP CODE | <4 pCi/L | >=4 pCi/L | Maximum | Average | Total Tests |
| 84621 | 33.3% | 66.7% | 9.2 | 7.3 | 3 |
| 84622 | 50.0% | 50.0% | 8.6 | 4.3 | 8 |
| 84623 | 50.0% | 50.0% | 6.1 | 3.8 | 2 |
| 84627 | 40.2% | 59.8% | 25.1 | 6.6 | 107 |
| 84629 | 33.3% | 66.7% | 34.2 | 8.6 | 39 |
| 84630 | 33.3% | 66.7% | 6.3 | 4.6 | 3 |
| 84632 | 46.7% | 53.3% | 21.7 | 6.6 | 15 |
| 84634 | 38.7% | 61.3% | 32.0 | 7.5 | 31 |
| 84642 | 45.7% | 54.3% | 33.7 | 6.2 | 35 |
| 84643 | 37.5% | 62.5% | 8.7 | 4.2 | 8 |
| 84646 | 77.8% | 22.2% | 6.4 | 2.7 | 9 |
| 84647 | 65.2% | 34.8% | 11.1 | 3.6 | 46 |
| 84662 | 46.7% | 53.3% | 9.3 | 4.4 | 15 |
| 84665 | 100.0% | 0.0% | 3.6 | 1.7 | 3 |
| 84667 | 25.0% | 75.0% | 7.6 | 4.3 | 4 |
| Sanpete | 45.4% | 54.6% | 34.2 | 6.0 | 328 |
| SEVIER | |||||
| ZIP CODE | <4 pCi/L | >=4 pCi/L | Maximum | Average | Total Tests |
| 84620 | 62.5% | 37.5% | 4.9 | 2.9 | 8 |
| 84652 | 100.0% | 0.0% | 2.9 | 1.4 | 6 |
| 84654 | 63.6% | 36.4% | 8.6 | 4.1 | 11 |
| 84657 | 0.0% | 100.0% | 7.0 | 7.0 | 1 |
| 84701 | 63.4% | 36.6% | 31.3 | 4.1 | 112 |
| 84711 | 33.3% | 66.7% | 7.4 | 4.6 | 6 |
| 84724 | 100.0% | 0.0% | 2.6 | 1.8 | 5 |
| 84730 | 28.6% | 71.4% | 37.2 | 13.2 | 14 |
| 84739 | 25.0% | 75.0% | 9.0 | 5.7 | 4 |
| 84754 | 23.9% | 76.1% | 101.3 | 22.1 | 71 |
| 84766 | 100.0% | 0.0% | 2.0 | 1.6 | 3 |
| Sevier | 50.2% | 49.8% | 101.3 | 9.8 | 241 |
| SUMMIT | |||||
| ZIP CODE | <4 pCi/L | >=4 pCi/L | Maximum | Average | Total Tests |
| 84017 | 66.1% | 33.9% | 33.0 | 4.9 | 62 |
| 84024 | 100.0% | 0.0% | 0.8 | 0.8 | 1 |
| 84033 | 54.5% | 45.5% | 11.0 | 3.8 | 11 |
| 84036 | 54.5% | 45.5% | 34.0 | 5.6 | 101 |
| 84055 | 56.0% | 44.0% | 18.3 | 4.8 | 25 |
| 84060 | 66.0% | 34.0% | 47.2 | 4.5 | 406 |
| 84061 | 41.7% | 58.3% | 10.8 | 4.4 | 12 |
| 84068 | 62.6% | 37.4% | 43.2 | 4.7 | 91 |
| 84098 | 63.8% | 36.2% | 375.8 | 5.7 | 820 |
| Summit | 63.4% | 36.6% | 375.8 | 5.2 | 1529 |
| TOOELE | |||||
| ZIP CODE | <4 pCi/L | >=4 pCi/L | Maximum | Average | Total Tests |
| 84022 | 100.0% | 0.0% | 3.2 | 1.1 | 17 |
| 84029 | 41.1% | 58.9% | 98.1 | 9.5 | 207 |
| 84034 | 86.4% | 13.6% | 11.4 | 2.3 | 22 |
| 84069 | 0.0% | 100.0% | 7.4 | 7.4 | 1 |
| 84071 | 79.2% | 20.8% | 12.1 | 3.3 | 24 |
| 84074 | 64.1% | 35.9% | 63.0 | 4.5 | 1399 |
| 84083 | 100.0% | 0.0% | 3.0 | 2.7 | 2 |
| Tooele | 62.1% | 37.9% | 98.1 | 5.1 | 1672 |
| UINTAH | |||||
| ZIP CODE | <4 pCi/L | >=4 pCi/L | Maximum | Average | Total Tests |
| 84026 | 100.0% | 0.0% | 2.9 | 1.2 | 6 |
| 84035 | 36.4% | 63.6% | 31.8 | 11.3 | 11 |
| 84039 | 66.7% | 33.3% | 4.1 | 1.8 | 3 |
| 84076 | 42.9% | 57.1% | 13.4 | 7.7 | 7 |
| 84078 | 65.5% | 34.5% | 40.5 | 4.0 | 423 |
| 84079 | 100.0% | 0.0% | 1.6 | 1.2 | 6 |
| 84085 | 60.0% | 40.0% | 34.7 | 11.6 | 5 |
| Uintah | 65.3% | 34.7% | 40.5 | 4.2 | 461 |
| UTAH | |||||
| ZIP CODE | <4 pCi/L | >=4 pCi/L | Maximum | Average | Total Tests |
| 84003 | 56.2% | 43.8% | 173.7 | 5.3 | 1624 |
| 84004 | 54.2% | 45.8% | 77.3 | 6.6 | 603 |
| 84005 | 76.8% | 23.2% | 76.9 | 3.1 | 466 |
| 84013 | 100.0% | 0.0% | 3.8 | 2.8 | 4 |
| 84042 | 65.4% | 34.6% | 45.1 | 5.2 | 280 |
| 84043 | 67.0% | 33.0% | 129.5 | 4.1 | 1465 |
| 84045 | 77.2% | 22.8% | 135.9 | 3.3 | 712 |
| 84057 | 71.5% | 28.5% | 358.9 | 4.5 | 648 |
| 84058 | 86.1% | 13.9% | 47.8 | 2.4 | 454 |
| 84059 | 95.6% | 4.4% | 24.6 | 1.8 | 68 |
| 84062 | 59.3% | 40.7% | 54.6 | 5.1 | 1156 |
| 84097 | 62.8% | 37.2% | 26.2 | 4.3 | 592 |
| 84601 | 74.2% | 25.8% | 31.4 | 3.2 | 287 |
| 84602 | 56.3% | 43.8% | 24.3 | 7.6 | 16 |
| 84603 | 71.4% | 28.6% | 4.2 | 2.5 | 7 |
| 84604 | 54.1% | 45.9% | 153.9 | 6.5 | 893 |
| 84605 | 37.5% | 62.5% | 9.1 | 4.9 | 8 |
| 84606 | 77.0% | 23.0% | 16.5 | 2.8 | 265 |
| 84626 | 66.7% | 33.3% | 5.7 | 3.3 | 3 |
| 84633 | 95.5% | 4.5% | 4.0 | 0.9 | 22 |
| 84651 | 68.9% | 31.1% | 481.4 | 6.2 | 472 |
| 84653 | 69.5% | 30.5% | 36.9 | 3.7 | 275 |
| 84655 | 46.2% | 53.8% | 41.0 | 7.1 | 93 |
| 84660 | 80.4% | 19.6% | 21.2 | 2.4 | 643 |
| 84663 | 58.9% | 41.1% | 178.2 | 6.1 | 666 |
| 84664 | 61.0% | 39.0% | 68.1 | 5.6 | 333 |
| Utah | 65.5% | 34.5% | 481.4 | 4.7 | 12055 |
| WASATCH | |||||
| ZIP CODE | <4 pCi/L | >=4 pCi/L | Maximum | Average | Total Tests |
| 84032 | 30.5% | 69.5% | 123.0 | 10.3 | 881 |
| 84049 | 43.6% | 56.4% | 103.9 | 9.9 | 298 |
| 84082 | 50.0% | 50.0% | 21.4 | 7.2 | 14 |
| Wasatch | 34.1% | 66.0% | 123.0 | 10.2 | 1193 |
| WASHINGTON | |||||
| ZIP CODE | <4 pCi/L | >=4 pCi/L | Maximum | Average | Total Tests |
| 84722 | 66.7% | 33.3% | 15.8 | 5.1 | 6 |
| 84725 | 100.0% | 0.0% | 3.6 | 2.1 | 8 |
| 84737 | 85.1% | 14.9% | 13.9 | 2.1 | 47 |
| 84738 | 97.2% | 2.8% | 4.0 | 1.7 | 36 |
| 84745 | 75.0% | 25.0% | 31.9 | 4.8 | 28 |
| 84746 | 86.7% | 13.3% | 8.0 | 2.4 | 15 |
| 84757 | 65.6% | 34.4% | 14.5 | 3.9 | 32 |
| 84763 | 50.0% | 50.0% | 10.4 | 5.8 | 4 |
| 84765 | 91.9% | 8.1% | 8.1 | 1.8 | 37 |
| 84767 | 62.5% | 37.5% | 4.7 | 3.2 | 8 |
| 84770 | 93.2% | 6.8% | 11.8 | 1.8 | 207 |
| 84771 | 100.0% | 0.0% | 0.8 | 0.5 | 3 |
| 84774 | 80.0% | 20.0% | 15.0 | 2.8 | 10 |
| 84779 | 50.0% | 50.0% | 5.9 | 3.8 | 2 |
| 84780 | 93.5% | 6.5% | 27.4 | 2.0 | 77 |
| 84781 | 100.0% | 0.0% | 1.5 | 1.3 | 2 |
| 84782 | 100.0% | 0.0% | 0.8 | 0.8 | 1 |
| 84783 | 80.0% | 20.0% | 10.2 | 2.9 | 10 |
| 84784 | 100.0% | 0.0% | 1.3 | 0.7 | 3 |
| 84790 | 87.9% | 12.1% | 12.7 | 2.2 | 257 |
| 84791 | 100.0% | 0.0% | 1.3 | 0.9 | 4 |
| Washington | 88.3% | 11.7% | 31.9 | 2.2 | 797 |
| WAYNE | |||||
| ZIP CODE | <4 pCi/L | >=4 pCi/L | Maximum | Average | Total Tests |
| 84715 | 50.0% | 50.0% | 18.8 | 5.7 | 8 |
| 84734 | 0.0% | 100.0% | 5.1 | 5.1 | 1 |
| 84747 | 47.1% | 52.9% | 117.5 | 11.8 | 17 |
| 84749 | 100.0% | 0.0% | 0.5 | 0.5 | 2 |
| 84773 | 33.3% | 66.7% | 15.9 | 8.0 | 6 |
| 84775 | 71.4% | 28.6% | 25.6 | 5.6 | 14 |
| Wayne | 54.2% | 45.8% | 117.5 | 7.9 | 48 |
| WEBER | |||||
| ZIP CODE | <4 pCi/L | >=4 pCi/L | Maximum | Average | Total Tests |
| 84067 | 94.4% | 5.6% | 19.4 | 1.8 | 161 |
| 84201 | 100.0% | 0.0% | 1.3 | 0.7 | 5 |
| 84310 | 38.2% | 61.8% | 152.4 | 12.1 | 285 |
| 84315 | 88.5% | 11.5% | 21.8 | 2.2 | 78 |
| 84317 | 44.3% | 55.7% | 98.4 | 9.7 | 88 |
| 84401 | 86.0% | 14.0% | 15.6 | 2.2 | 278 |
| 84402 | 20.0% | 80.0% | 15.4 | 7.5 | 5 |
| 84403 | 73.0% | 27.0% | 53.5 | 3.5 | 622 |
| 84404 | 66.7% | 33.3% | 144.4 | 5.1 | 430 |
| 84405 | 72.1% | 27.9% | 23.1 | 3.3 | 412 |
| 84408 | 100.0% | 0.0% | 1.3 | 1.0 | 3 |
| 84409 | 50.0% | 50.0% | 8.3 | 5.4 | 2 |
| 84412 | 50.0% | 50.0% | 18.9 | 7.6 | 4 |
| 84414 | 51.8% | 48.2% | 27.1 | 5.3 | 575 |
| 84415 | 100.0% | 0.0% | 3.4 | 2.7 | 5 |
| Weber | 66.4% | 33.6% | 152.4 | 4.8 | 2953 |
| STATE TOTALS | |||||
| TOTALS | <4 pCi/L | >=4 pCi/L | Maximum | Average | Total Tests |
| Web Table | 64.6% | 35.4% | 664 | 4.9 | 64307 |
| Master List | 64307 | ||||
| The data is informational only and should not be utilized for the purpose of determining where one should test nor where radon control systems should or should not be incorporated in new home construction. | |||||